Nomad Tracing
OpenTelemetry: Tracing pour Nomad en utilisant Tempo, et Grafana

Il nous manque plus qu’à mettre du Tracing. Pour ce faire on va déployer Temp, et utiliser Grafana pour les exploiter
Déployer Tempo
On crée le fichier prometheus.hcl.
  0job "tempo" {
  1  datacenters = ["services"]
  2  type        = "service"
  3  group "tempo" {
  4    count = 1
  5    network {
  6      port "tempo" {
  7          to = "3400"
  8          static = "32400"
  9      }
 10      port "tempo-write" {
 11        static = "32318"
 12        to = "4318"
 13      }
 14    }
 15    restart {
 16      attempts = 3
 17      delay    = "20s"
 18      mode     = "delay"
 19    }
 20    service {
 21        name = "tempo-write"
 22        port = "tempo-write"
 23        provider = "nomad"
 24        tags = [
 25         		"traefik.enable=true",
 26            "traefik.http.routers.tempo-write.service=tempo-write",
 27            "traefik.http.routers.tempo-write.rule=Host(`tempo-write.service.local`)",
 28            "traefik.http.routers.tempo-write.tls=false",
 29        ]
 30    }
 31    service {
 32        name = "tempo-read"
 33        port = "tempo"
 34        provider = "nomad"
 35        tags = [
 36          	"traefik.enable=true",
 37            "traefik.http.routers.tempo-read.service=tempo-read",
 38            "traefik.http.routers.tempo-read.rule=Host(`tempo-read.service.local`)",
 39            "traefik.http.routers.tempo-read.tls=false",
 40        ]
 41    }
 42    service {
 43        name = "tempo"
 44        port = "tempo"
 45        provider = "nomad"
 46        tags = [
 47          	"traefik.enable=false",
 48        ]
 49    }
 50    task "tempo" {
 51      driver = "docker"
 52
 53      env {
 54        JAEGER_AGENT_HOST    = "tempo.service.internal"
 55        JAEGER_TAGS          = "cluster=nomad"
 56        JAEGER_SAMPLER_TYPE  = "probabilistic"
 57        JAEGER_SAMPLER_PARAM = "1"
 58      }
 59
 60      config {
 61        image = "docker.io/grafana/tempo:2.7.2"
 62        ports = ["tempo", "tempo-write"]
 63        args = [
 64          "-config.file=/local/tempo/tempo.yml",
 65          "-server.http-listen-port=${NOMAD_PORT_tempo}",
 66        ]
 67        volumes = [
 68          "local/tempo:/local/tempo",
 69        ]
 70      }
 71      template {
 72        data = <<EOH
 73---
 74stream_over_http_enabled: true
 75server:
 76  http_listen_port: 3400
 77  log_level: info
 78cache:
 79  background:
 80    writeback_goroutines: 5
 81query_frontend:
 82  search:
 83    duration_slo: 5s
 84    throughput_bytes_slo: 1.073741824e+09
 85    metadata_slo:
 86        duration_slo: 5s
 87        throughput_bytes_slo: 1.073741824e+09
 88  trace_by_id:
 89    duration_slo: 100ms
 90  metrics:
 91    max_duration: 120h                # maximum duration of a metrics query, increase for local setups
 92    query_backend_after: 5m
 93    duration_slo: 5s
 94    throughput_bytes_slo: 1.073741824e+09
 95distributor:
 96  receivers:
 97    otlp:
 98      protocols:
 99        http:
100          endpoint: "0.0.0.0:4318"
101ingester:
102compactor:
103  compaction:
104    block_retention: 24h                # overall Tempo trace retention. set for demo purposes
105metrics_generator:
106  registry:
107    external_labels:
108      source: tempo
109      cluster: docker-compose
110  storage:
111    path: /var/tempo/generator/wal
112  traces_storage:
113    path: /var/tempo/generator/traces
114  processor:
115    local_blocks:
116      filter_server_spans: false
117      flush_to_storage: true
118storage:
119  trace:
120    backend: local                     # backend configuration to use
121    wal:
122      path: /var/tempo/wal             # where to store the wal locally
123    local:
124      path: /var/tempo/blocks
125overrides:
126  defaults:
127    metrics_generator:
128      processors: [service-graphs, span-metrics, local-blocks] # enables metrics generator
129      generate_native_histograms: both
130EOH
131        change_mode   = "signal"
132        change_signal = "SIGHUP"
133        destination   = "local/tempo/tempo.yml"
134      }
135      resources {
136        cpu    = 200
137        memory = 450
138      }
139      service {
140        name = "tempo"
141        port = "tempo"
142        provider = "nomad"
143        check {
144          name     = "Tempo HTTP"
145          type     = "http"
146          path     = "/ready"
147          interval = "5s"
148          timeout  = "2s"
149
150          check_restart {
151            limit           = 2
152            grace           = "60s"
153            ignore_warnings = false
154          }
155        }
156      }
157    }
158  }
159}
Alors ici la configuration est plus complexe et importante. En effet les traces vont générer une forte volumétrie de données.
Changer le storage, et configurer une autre tâche pour archiver les traces avant la purge si vous souhaitez les garder si vous souhaitez pouvoir y faire de l’archéologie. De plus il faudrait aussi changer le taux d’échantillage JAEGER_SAMPLER_PARAM, car enregistrer et garder toutes les traces ça risque de faire beaucoup.
Enfin, au vue de la volumétrie il est possible que le service exit suite à une erreur OOM. Il faudrait alors voir à augmenter les ressources (ici la mémoire).
Ajouter d’export des Tracing depuis Traefik
On va ajouter les arguments suivants dans la configuration de Traefik.
0          "--tracing=true",
1          "--tracing.otlp=true",
2          "--tracing.otlp.http=true",
3          "--tracing.otlp.http.endpoint=https://tempo-write.service.local/v1/traces",
Et voila, suffit d’ajouter une datasource dans Grafana pointant sur tempo-read.service.local.
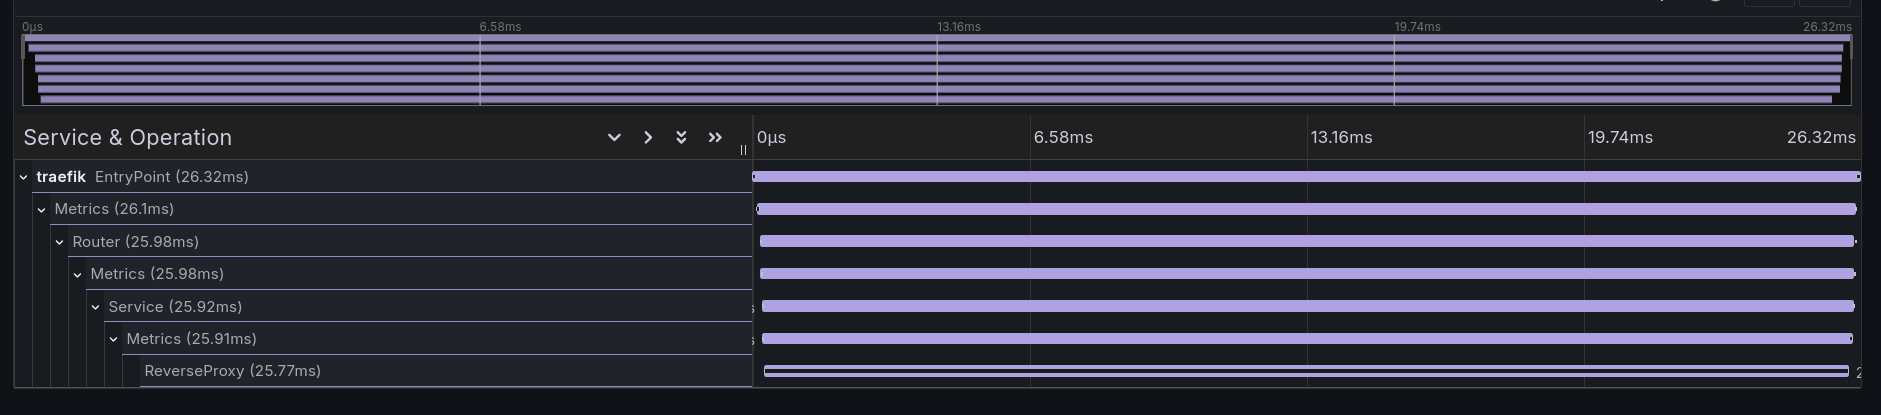
Et voila, reste plus qu’a explorer la datasource tempo et vous pourrez voir des traces.
Conclusion
Il rest encore pas de travail pour rendre le tout vraiment exploitable, mais cela dépend plus de votre contexte spécifique. Pour aller plus loin je vous propose d’aller lire https://opentracing.io, et de regarder comment vous pourriez l’utiliser efficacement.